KEY HEADLINES & INSIGHTS
Fitch Solutions has raised its forecast for Ghana’s 2026 current account surplus to 7.8% of GDP, from 5.2%, following a stronger than expected trade performance in the first half of the year. Ghana recorded a US$4.3 billion merchandise trade surplus in H1 2026, far above the US$700 million average recorded in the first halves of 2016–2025, driven mainly by strong gold exports and rising crude oil shipments. Fitch expects the current account surplus to narrow in 2027 but remain sizeable, while noting that Ghana’s external position will continue to depend heavily on commodity exports and global prices
Investment activity in Ghana surged by 53% in the second quarter of 2026, recording the strongest acceleration among expenditure components as domestic demand strengthened, according to the Ghana Statistical Service. The increase in investment came despite a significant slowdown in consumption, highlighting investment as a key driver of domestic demand during the period.
Global markets are being driven by oil prices above US$100 a barrel, rising inflation fears and uncertainty over upcoming interest-rate decisions. Meanwhile, AI and technology stocks are weakening, while the US dollar and gold remain strong amid heightened geopolitical tensions.
PRIMARY DEBT MARKET ISSUANCE WEEK
Yields on Government of Ghana Treasury bills declined across all tenors this week, supported by strong liquidity and firm investor demand. The 91-day bill fell to 4.69% (-11.01bps), while the 182-day bill declined to 6.51% (-17.24bps). Similarly, the 364-day bill decreased marginally to 10.10% (-1.52bps), reflecting continued demand across the curve. Overall, comfortable liquidity conditions and robust investor demand continued to drive yields lower across the Treasury bill market.
| Security | Current Wk % | Previous Wk % | Bps |
|---|---|---|---|
| 91-Day GoG Bill | 4.6949 | 4.8050 | -11.01 |
| 182-Day GoG Bill | 6.5107 | 6.6831 | -17.24 |
| 364-Day GoG Bill | 10.1017 | 10.1169 | -1.52 |
Source(s): Bank of Ghana
GHANA FIXED INCOME MARKET VOLUME TRADED
The Ghana Fixed Income Market (GFIM) recorded approximately GH₵6.69billion in traded volume across 1,746 transactions during the week, with DDEP Bonds accounting for the largest share of turnover at 56.90% despite representing only 7.90% of transactions, indicating fewer but significantly larger value trades and continued institutional activity in Ghana’s domestic bond market following the debt restructuring. Treasury Bills accounted for 33.99% of traded volume and dominated transaction activity with 81.10% of all trades, reflecting continued investor preference for short-term government securities given their high liquidity, regular weekly issuance, and sustained demand as the Government relies on T-Bills for domestic financing. New GoG Notes & Bonds contributed 4.85% of total turnover, while Corporate Bonds accounted for 2.26%, with Sell/Buy Back Trades contributing 1.97% of traded volume, mainly reflecting short-term liquidity management activity. Old GoG Notes & Bonds remained marginal at just 0.02% of total turnover.Overall, the week’s GFIM activity was driven by large-value DDEP Bond transactions alongside strong transaction activity in Treasury Bills, highlighting continued institutional participation in restructured bonds while short-term government securities remain the most actively traded instruments in the domestic market.
Daily Volume (GHS) Traded – GFIM
Week's Yield Curve
EQUITY MARKET
Trading activity on the Ghana Stock Exchange recorded 33.41 million shares traded at a total value of GH₵163.64 million during the week, with the Telecommunications sector leading activity at 19.56 million shares worth GH₵133.81 million, making it the largest contributor to both traded volume and value. This strong performance reflects sustained investor interest in telecommunications stocks and their significant contribution to overall market turnover. The Financial sector followed with 10.65 million shares valued at GH₵26.32 million, making it the second largest contributor to traded value, while Advertising recorded 1.88 million shares worth GH₵620,533. Healthcare recorded 1.02 million shares valued at GH₵742,081. Other sectors recorded comparatively lower activity, including Agriculture at 101,996 shares worth GH₵335,397, Oil & Gas at 83,176 shares valued at GH₵779,197, Insurance at 57,153 shares worth GH₵330,328, and Food & Beverage at 23,867 shares valued at GH₵384,230. Technology, Manufacturing, Mining, and Education recorded minimal activity. Overall, the week’s trading activity was dominated by Telecommunications and Financials in terms of both volume and value, with Telecommunications alone accounting for over 80% of total traded value, highlighting strong investor participation and concentration in the sector.
| Index | Level | WoW% | MoM% | YoY% |
|---|---|---|---|---|
| GSE-CI | 14,611.1500 | -1.370 | -3.085 | 66.599 |
| FSI | 7,607.4600 | -2.694 | -3.759 | 63.701 |
| Market Cap (Bn) | 276.2563 | -1.522 | -3.264 | 60.574 |
Source(s): Ghana Stock Exchange
Week's Equities Top Gainers & Laggards
EQUITY MARKET MOST TRADED STOCKS
| Ticker | Traded Volume | Price (GHS) |
|---|---|---|
| MTNGH | 19,559,291.00 | 6.85 |
| ETI | 6,316,667.00 | 1.70 |
| TBL | 3,277,423.00 | 1.20 |
| DIGICUT | 1,875,295.00 | 0.32 |
| KASA | 1,171,485.00 | 1.86 |
Source(s): Ghana Stock Exchange
| Country | Index | Level | YTD % |
|---|---|---|---|
| Tanzania | DSE-ASI | 4,658.31 | +68.66 |
| Ghana | GSE-CI | 14,611.15 | +66.60 |
| Zimbabwe | ZSE-ASI | 453.25 | +63.12 |
| West Africa (BRVM) | BRVM-CI | 555.48 | +60.66 |
| Nigeria | NGX-ASI | 243,052.74 | +56.19 |
Source(s): African Markets
COMMODITY MARKET
Commodity markets recorded mixed performance during the week. Brent crude rose to US$104.61 per barrel, gaining 8.65% weekly, 15.60% monthly, 43.46% quarterly and 71.91% year-on-year, driven by heightened geopolitical tensions in the Middle East and growing concerns over global supply disruptions, including attacks on energy infrastructure and reduced shipping activity through key oil routes.
Gold declined to US$4,366.20 per ounce, falling 1.44% weekly and 1.46% monthly, although it remained up 8.53% quarterly and 0.94% year-on-year. The decline was driven by a stronger U.S. dollar and increased expectations of tighter U.S. monetary policy following persistent inflation concerns, reducing demand for the non-yielding asset.
Cocoa fell to US$5,933 per tonne, declining 2.45% weekly and 10.78% monthly, while remaining up 18.61% quarterly and down 2.18% year-on-year, amid changing supply and demand expectations and continued uncertainty around West African production and exports. Overall, Brent recorded strong gains across all periods amid supply concerns, while gold and cocoa experienced short-term declines despite maintaining positive quarterly returns.
Source(s): Yahoo Finance, Trading Economics
CURRENCY MARKET
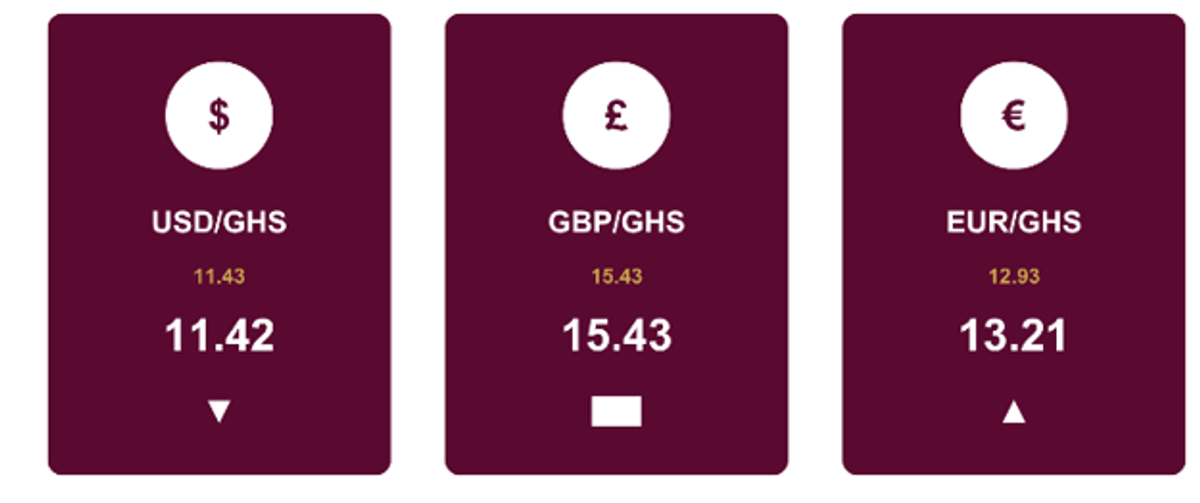
The Ghanaian cedi recorded mixed movements against the major trading currencies as of 14 September 2026. The USD/GHS rate stood at GH¢11.42, with the cedi appreciating marginally by 0.09% over the week, while depreciating by 1.60% over the month and 4.77% year-on-year. On a quarterly basis, the cedi depreciated by 1.24%.
The EUR/GHS rate stood at GH¢13.21, reflecting a 2.23% weekly and 1.34% monthly depreciation of the cedi against the euro. Over the quarter, the cedi weakened by 2.57%, while its yearly performance showed a 7.16% depreciation.
The GBP/GHS rate stood at GH¢15.43, remaining unchanged across the weekly, monthly, quarterly and yearly periods. Overall, the cedi showed relative stability against the US dollar in the short term but recorded broader depreciation against both the US dollar and euro across the monthly, quarterly and yearly periods, with the euro recording the largest year-on-year decline. The cedi’s unchanged performance against the pound, however, indicates relative stability against sterling.
Source(s): Bank of Ghana